Learning ranking algorithms by getting one wrong first
I don’t have a background in ranking algorithms. Whenever concertje needs something I haven’t built before, I learn it on the spot. The score behind the Trending lane is one of those things.
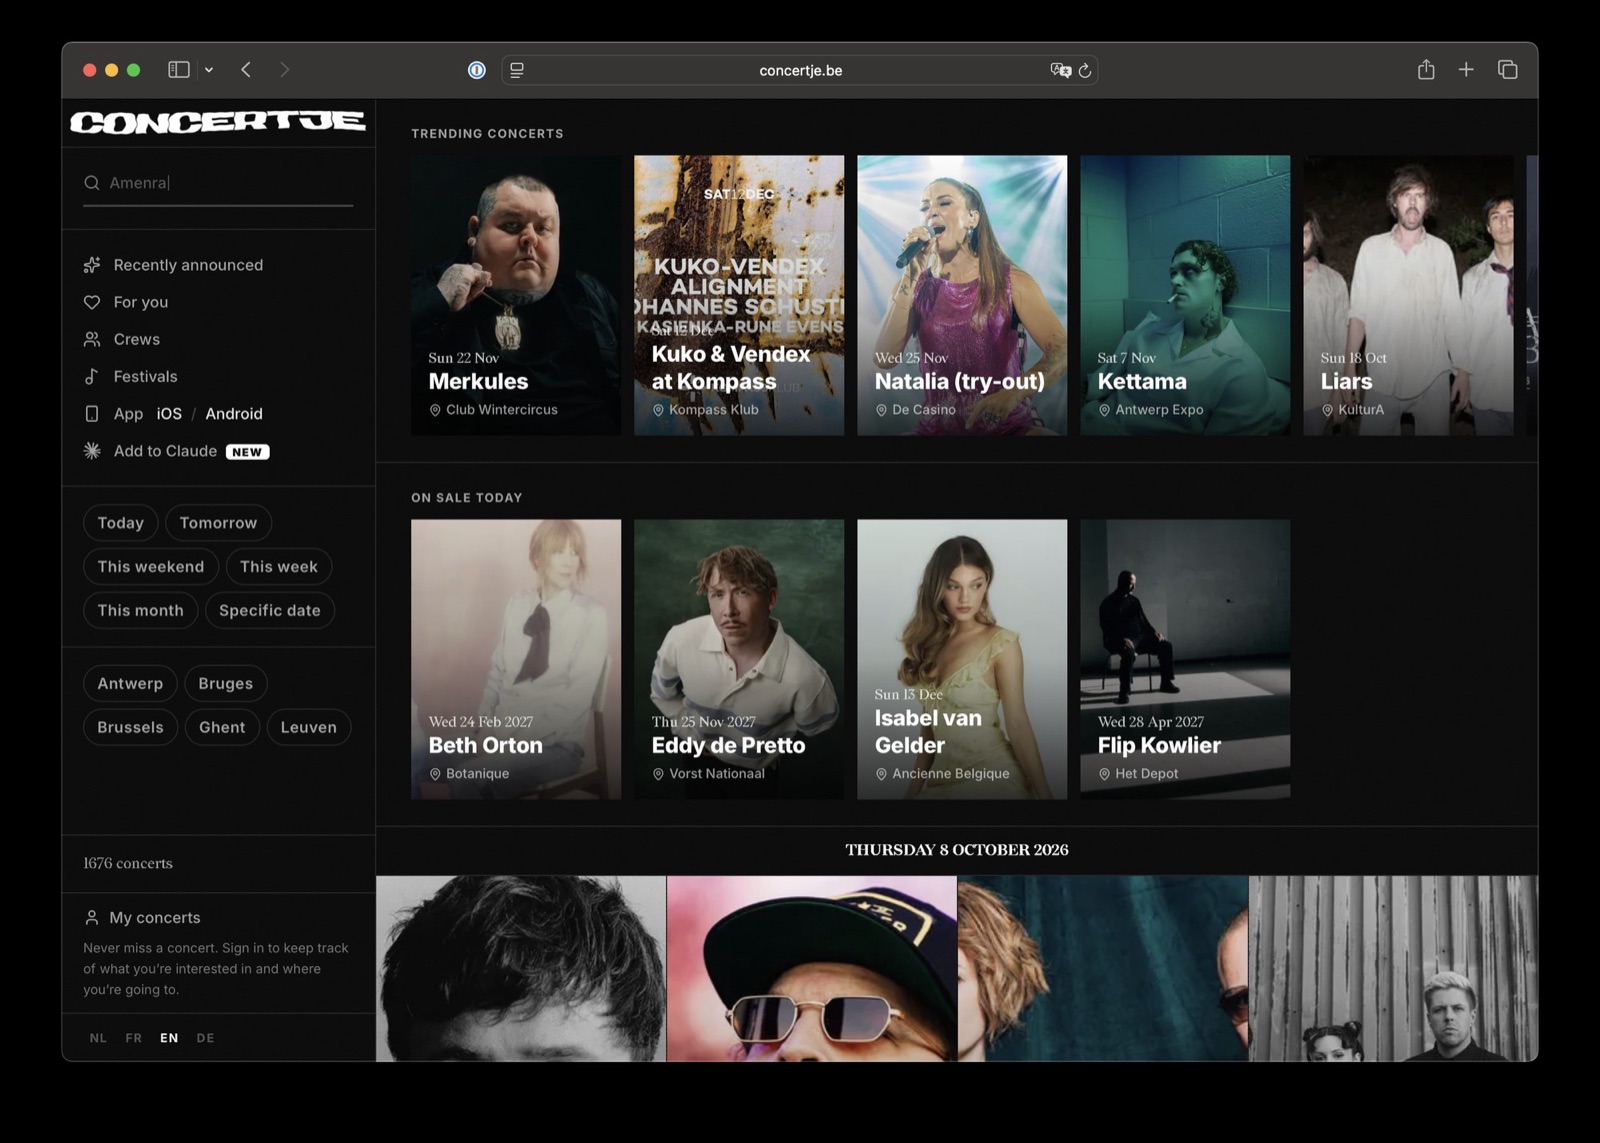 The Trending lane on concertje.be, running on the new score.
A few weeks ago I noticed that Trending kept looking the same. The same club nights at Kompass, the same handful of venues, sometimes the same artist twice. Some of those shows really are popular. But a lane that always shows the same places isn’t telling anyone what is trending, and it isn’t fair to the hundreds of other shows on the site.
So I went back to the formula, worked out why it behaved like that, and read how other people rank things. This is what I found.
The Concert Interest Score
Every concert on concertje gets a number between 0 and 100 every night. I call it the Concert Interest Score, or CIS. It decides which shows get a HOT or TRENDING badge, the order of the “recently announced” list in the newsletter, and, until this week, the order of the Trending lane.
The input is behaviour on the site. A nightly job writes one row per concert per day: page views, ticket clicks, shares, and how often someone played an audio preview. The score is built from that, plus a few things we know about the show itself.
Version one
The first version added up four parts, each with its own weight.
\[\text{CIS} = 0.35 \cdot \text{LocalIntent} + 0.30 \cdot \text{Momentum} + 0.25 \cdot \text{Base} + 0.10 \cdot \text{Scarcity}\]LocalIntent is how much attention a show gets on concertje over the last 30 days. A page view is worth 1 point, a ticket click 8, a share 10, a preview 2. That total goes on a log scale against the busiest show, so the top show gets 100 and the rest fall below it.
Momentum asks whether interest is speeding up. It compares the daily view rate of the last 14 days with the 16 days before. Same rate gives 50, faster goes up, slower goes down.
Base is how popular the headliner is, from their listener count on a log scale up to 10 million listeners. An artist we couldn’t match got 20.
Scarcity comes from the ticket status. Sold out is 100, waitlist 95, limited 80. Without a status, the score climbs as the show gets closer.
The Trending lane then took the highest scores, and that was it.
Every part of it makes sense on its own. It still went wrong, and on 8 October I sat down with the production data to find out where.
What went wrong
Most scores were noise. 83% of upcoming Belgian shows had fewer than five page views in 30 days. For those shows the score came down to the headliner’s listener count, the number of days until the show, and a few random clicks.
Momentum worked like a bonus for being just announced. Two views in the last two weeks were enough for a momentum of 59, worth about 18 points of CIS. A techno night at Flanders Expo hit the maximum of 100 from 40 views and one ticket click. A brand-new show always looks like it is accelerating, because there is nothing before it to compare with.
Base barely told acts apart. Kruelty, with 42,000 listeners, scored 66. Bryan Adams, with 3.1 million, scored 93. Seventy-five times more listeners was worth about seven points in the final score.
Counting page views rewarded venues whose audience googles. Around 85% of the views on Kompass shows come from Google. That works out to about 44 views per show, against 4.3 for a show at the AB. These are real buyers: 42% of them click through to tickets. But counting every page view meant the venue whose audience searches hardest won, and someone refreshing a page counted twice.
Nothing stopped duplicates either: James Blake had two of the twelve slots.
On top of that, the lane listed the shows with the highest score. Those are the shows that are already hot, while I wanted Trending to show the ones picking up.
Reading up
This is the part I enjoy most about learning as I go. Somebody has always run into the same problem, and usually written it down.
Twitter’s 2010 post on how trends work and a later study of Twitter trends say the same thing: a topic trends when it moves faster than its own usual pace, however big or small it is. Wikimedia’s design for trending articles adds smoothing and a minimum volume, so a page going from zero views to two doesn’t count as a surge.
Evan Miller’s How not to sort by average rating and his piece on Bayesian averages explain why a score built on very little data should be pulled down until the data is there. That described my momentum score.
Lemmy’s ranking docs were a good read on log scales for numbers that snowball, like listener counts.
For the “same venue over and over” problem, the research term is provider fairness. Papers like Marras et al. and P-MMF re-rank results so a few providers can’t take the whole list. Their methods are a lot more involved than what concertje needs. The simplest version is a cap, so that’s what I used.
Version two
The weights changed first. LocalIntent went up to 40%, momentum went down to 15%, and base went up to 35%. Scarcity stayed at 10%.
\[\text{CIS} = 0.40 \cdot \text{LocalIntent} + 0.15 \cdot \text{Momentum} + 0.35 \cdot \text{Base} + 0.10 \cdot \text{Scarcity}\]LocalIntent now counts unique visitors instead of page views. Refreshes and repeat visits no longer add up. Ticket clicks still weigh eight times as much, and they now count people too: one person clicking four times is one click. Of the ticket clicks in the last 30 days, 24% were repeats.
Momentum now depends on how much data a show has. It reaches full strength at 20 views in 30 days and is reduced below that. No views means zero. My first draft gave a show with no views a neutral 50, and that put 220 shows nobody had ever opened over the TRENDING threshold, so I changed it to zero.
Try it: two views in the last two weeks and none before is the “just announced” case.
Base now runs from 10,000 listeners at 0 to 5 million at 100. Kruelty and Bryan Adams are properly apart now. An artist we can’t match gets 0 instead of 20, because an act that shows up nowhere is almost always small.
Bot traffic is left out. It made up 7% of concert views, enough to push a small show over the minimum for the lane.
Trending gets its own score
The bigger change is that the Trending lane doesn’t read CIS anymore. It ranks on lift: how this week compares with the show’s own recent past.
\[\text{lift} = \log_2\left(\frac{\text{points}_{\text{last 7 days}} + 10}{\text{weekly average}_{\text{21 days before}} + 10}\right)\]Points are the same engagement points CIS uses. The +10 is the smoothing from the Wikimedia design: a show going from 0 to 2 visitors stays flat, while a show with real new traffic still rises. A show needs at least three visitors this week to qualify.
Without the smoothing, a show going from nothing to two points is an infinite jump. With it, the same show is barely rising.
Then the fairness rules. Each headliner appears once. Each venue gets at most two slots. Sold-out shows sink below ones you can still buy. And if fewer than five shows are rising, the lane is hidden. An empty lane is better than one filled with noise, which is the situation in the Netherlands right now.
Lift is calculated in the nightly job and stored on the concert, because the underlying data only changes once a day anyway.
Before and after
I ran both versions against the same day of production data for the Belgian top 12.
Club and electronic nights went from six of the twelve slots to three. Erykah Badu, Mogwai, Fontaines D.C. and the Mountain Goats moved in. Konnected, Charlotte de Witte, Kruelty, SIZZLEPROOF, Kate Ryan and Mad Caddies moved out.


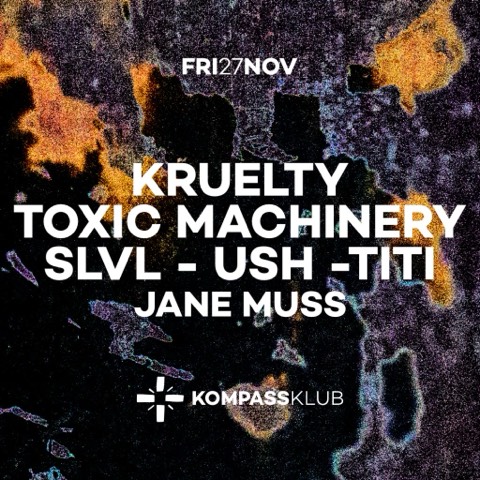



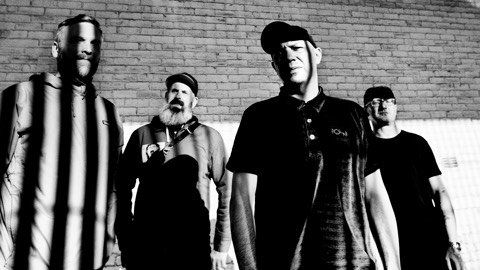


Kompass didn’t disappear, and it shouldn’t. Kettama and the two biggest Kompass nights stayed. Vieze Asbak at Kompass climbed to number two, and earned it with 139 views and 84 ticket clicks in a month.


The badges got stricter too. HOT went from 150 upcoming shows to 35, TRENDING from 594 to 308.
What is still open
The lane sends traffic to the shows it lists, which makes them look like they’re trending. The 21-day baseline softens that, because the extra traffic becomes part of the show’s normal level within a few weeks. The papers on popularity bias call this the rich-get-richer loop, and I haven’t solved it.
Shows also get busier in their final week. On past shows, the last week gets about 3.4 times the traffic of the weeks before. The proper fix is to compare each show against an expected curve. Today that wouldn’t change the top 12, so I’m leaving it until it does.
None of this is new to anyone who ranks things for a living, but it was new to me. Open concertje.be and see what’s rising this week.